
Tourism · 17 Nov 2026

A bumpy ride for New Zealand accommodation

The tough economy of 2024–25 shows up clearly in the accommodation data, and the recovery is uneven.

It's been a bumpy ride for New Zealand accommodation. The tough economy of 2024–25 shows up clearly: 12-month occupancy fell from 55.6% in March 2024 to 52.9% in mid-2025, and has only partly recovered.
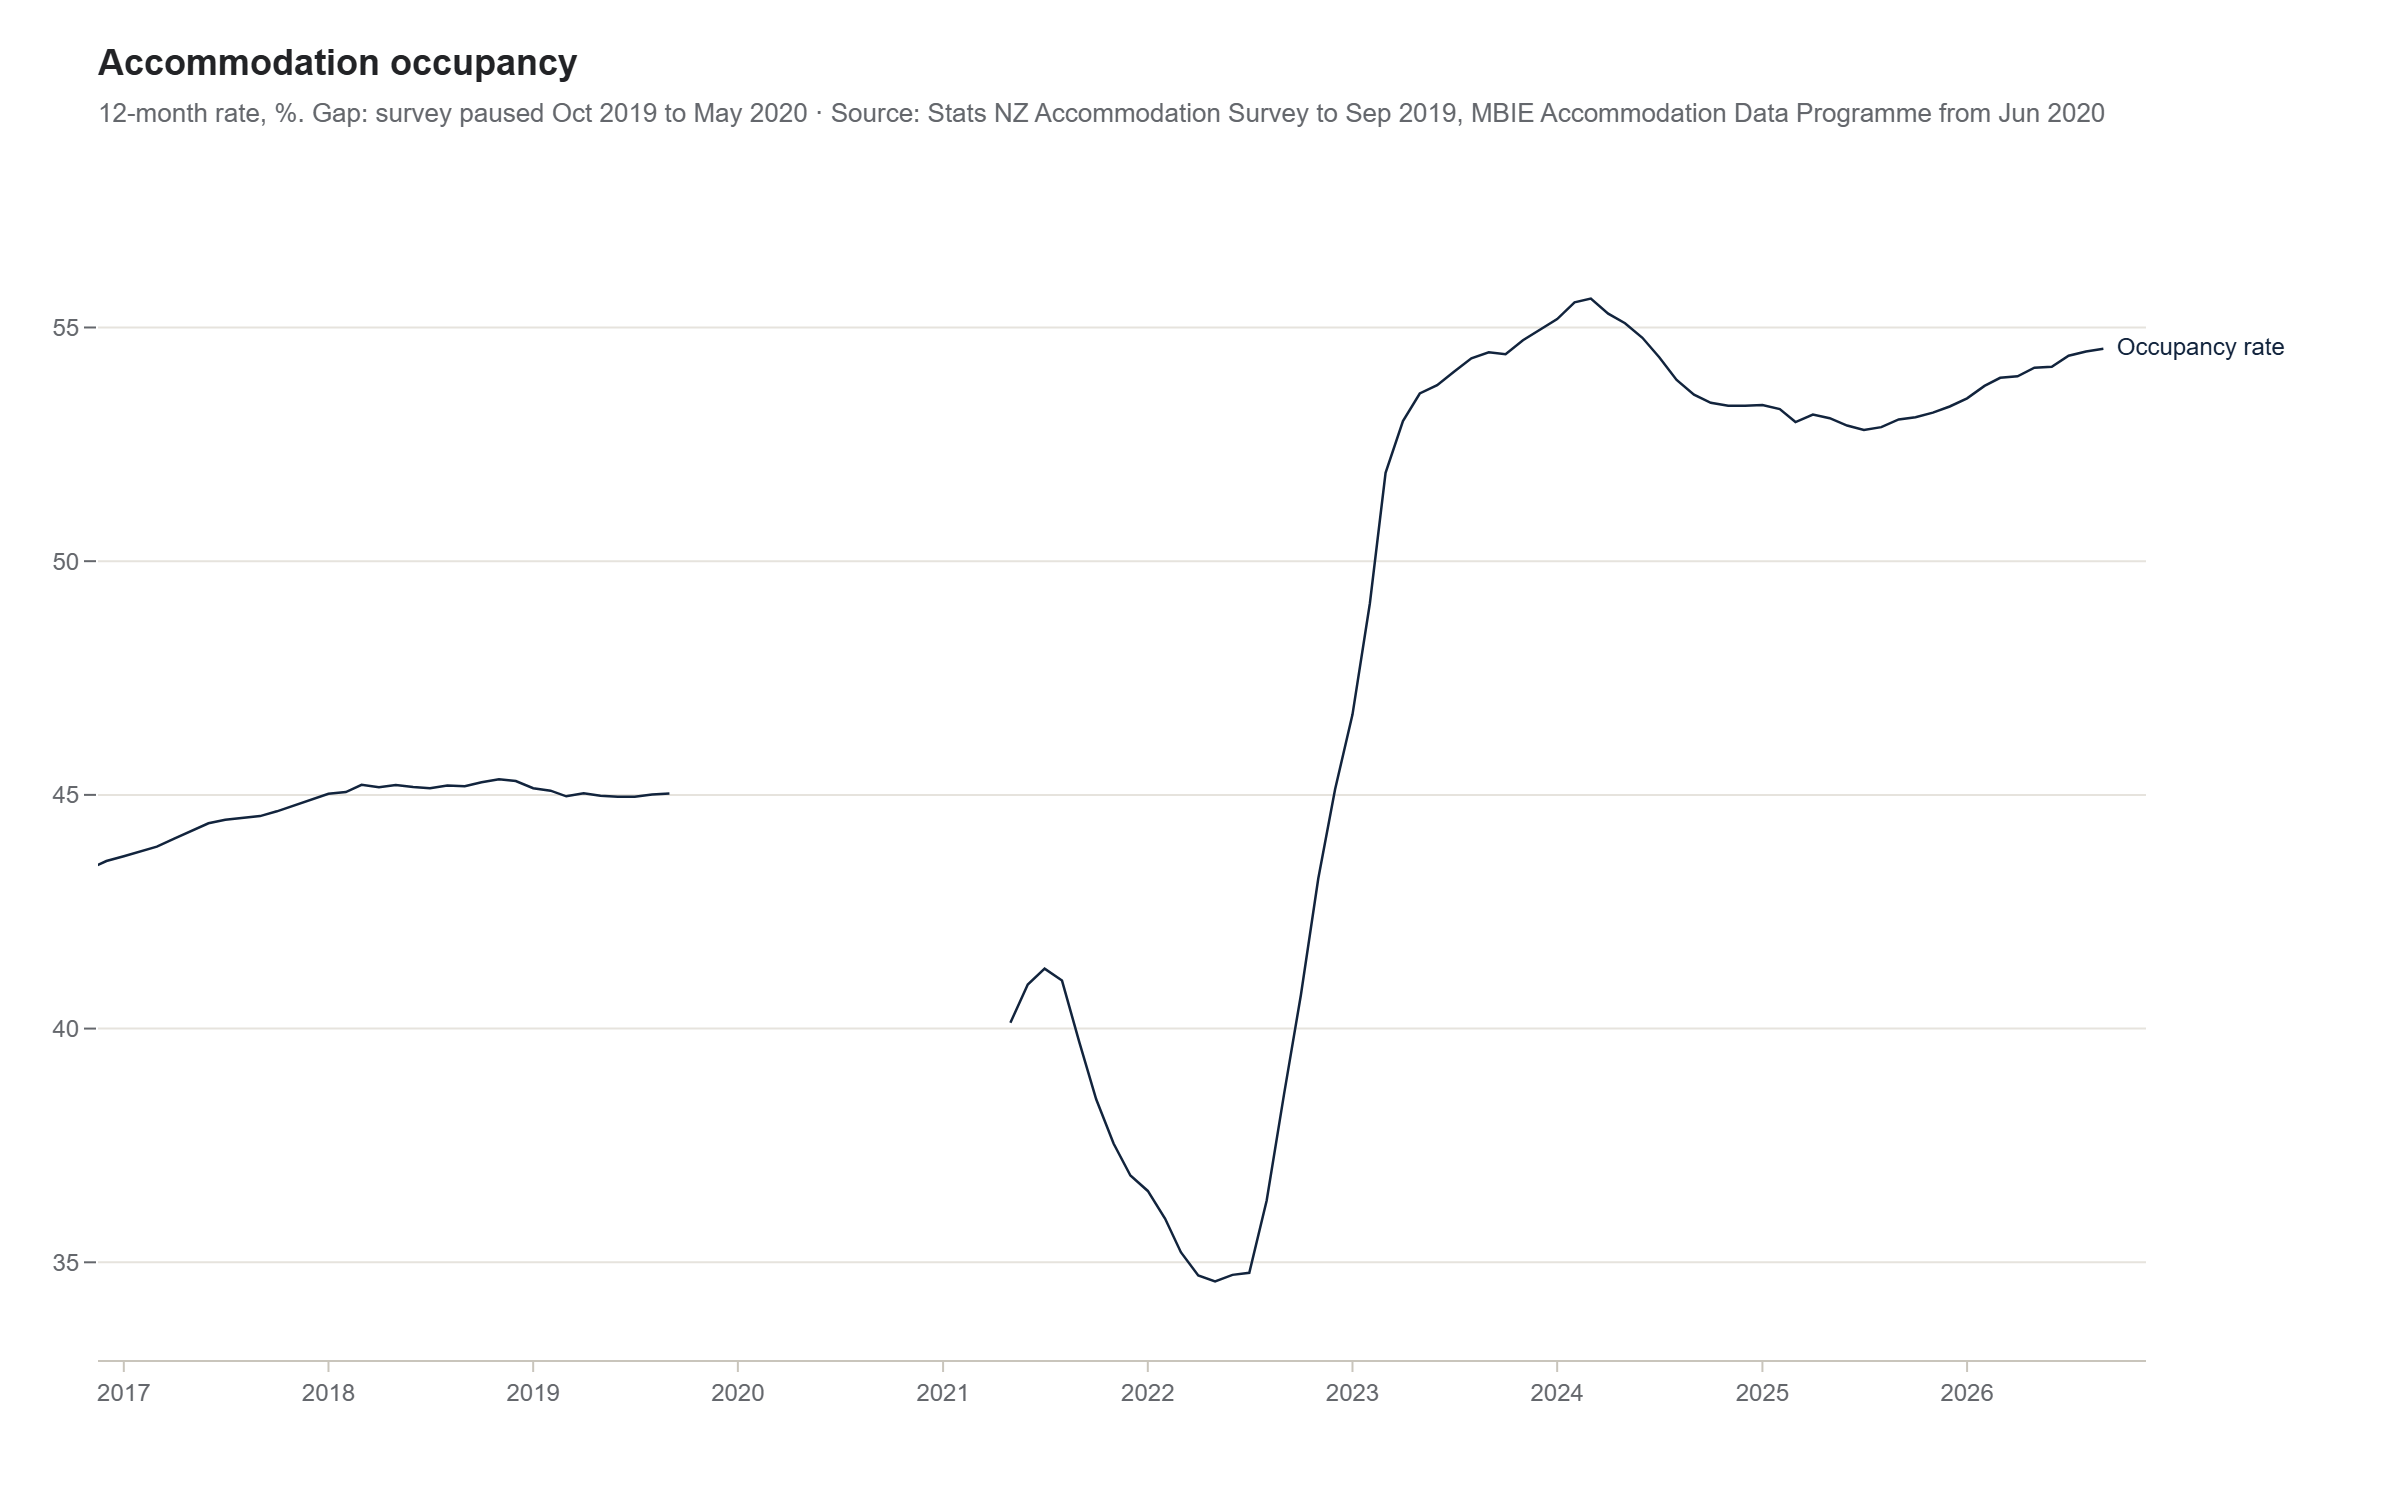
Line chart of New Zealand accommodation occupancy, 12-month rate, 2017 to 2026. About 45% before a gap from late 2019 to 2021, a fall to 35% in 2022, a peak of 55.6% in early 2024, a dip to 52.9% in mid-2025 and 54.5% now.
Occupancy: occupied stay-unit nights as a share of available stay-unit nights, over the latest 12 months.

That weakness was almost entirely domestic. Domestic guest nights fell by about a million a year, while international nights kept growing. The recovery is uneven too. Auckland and Queenstown are pulling ahead while the rest of the country struggles.
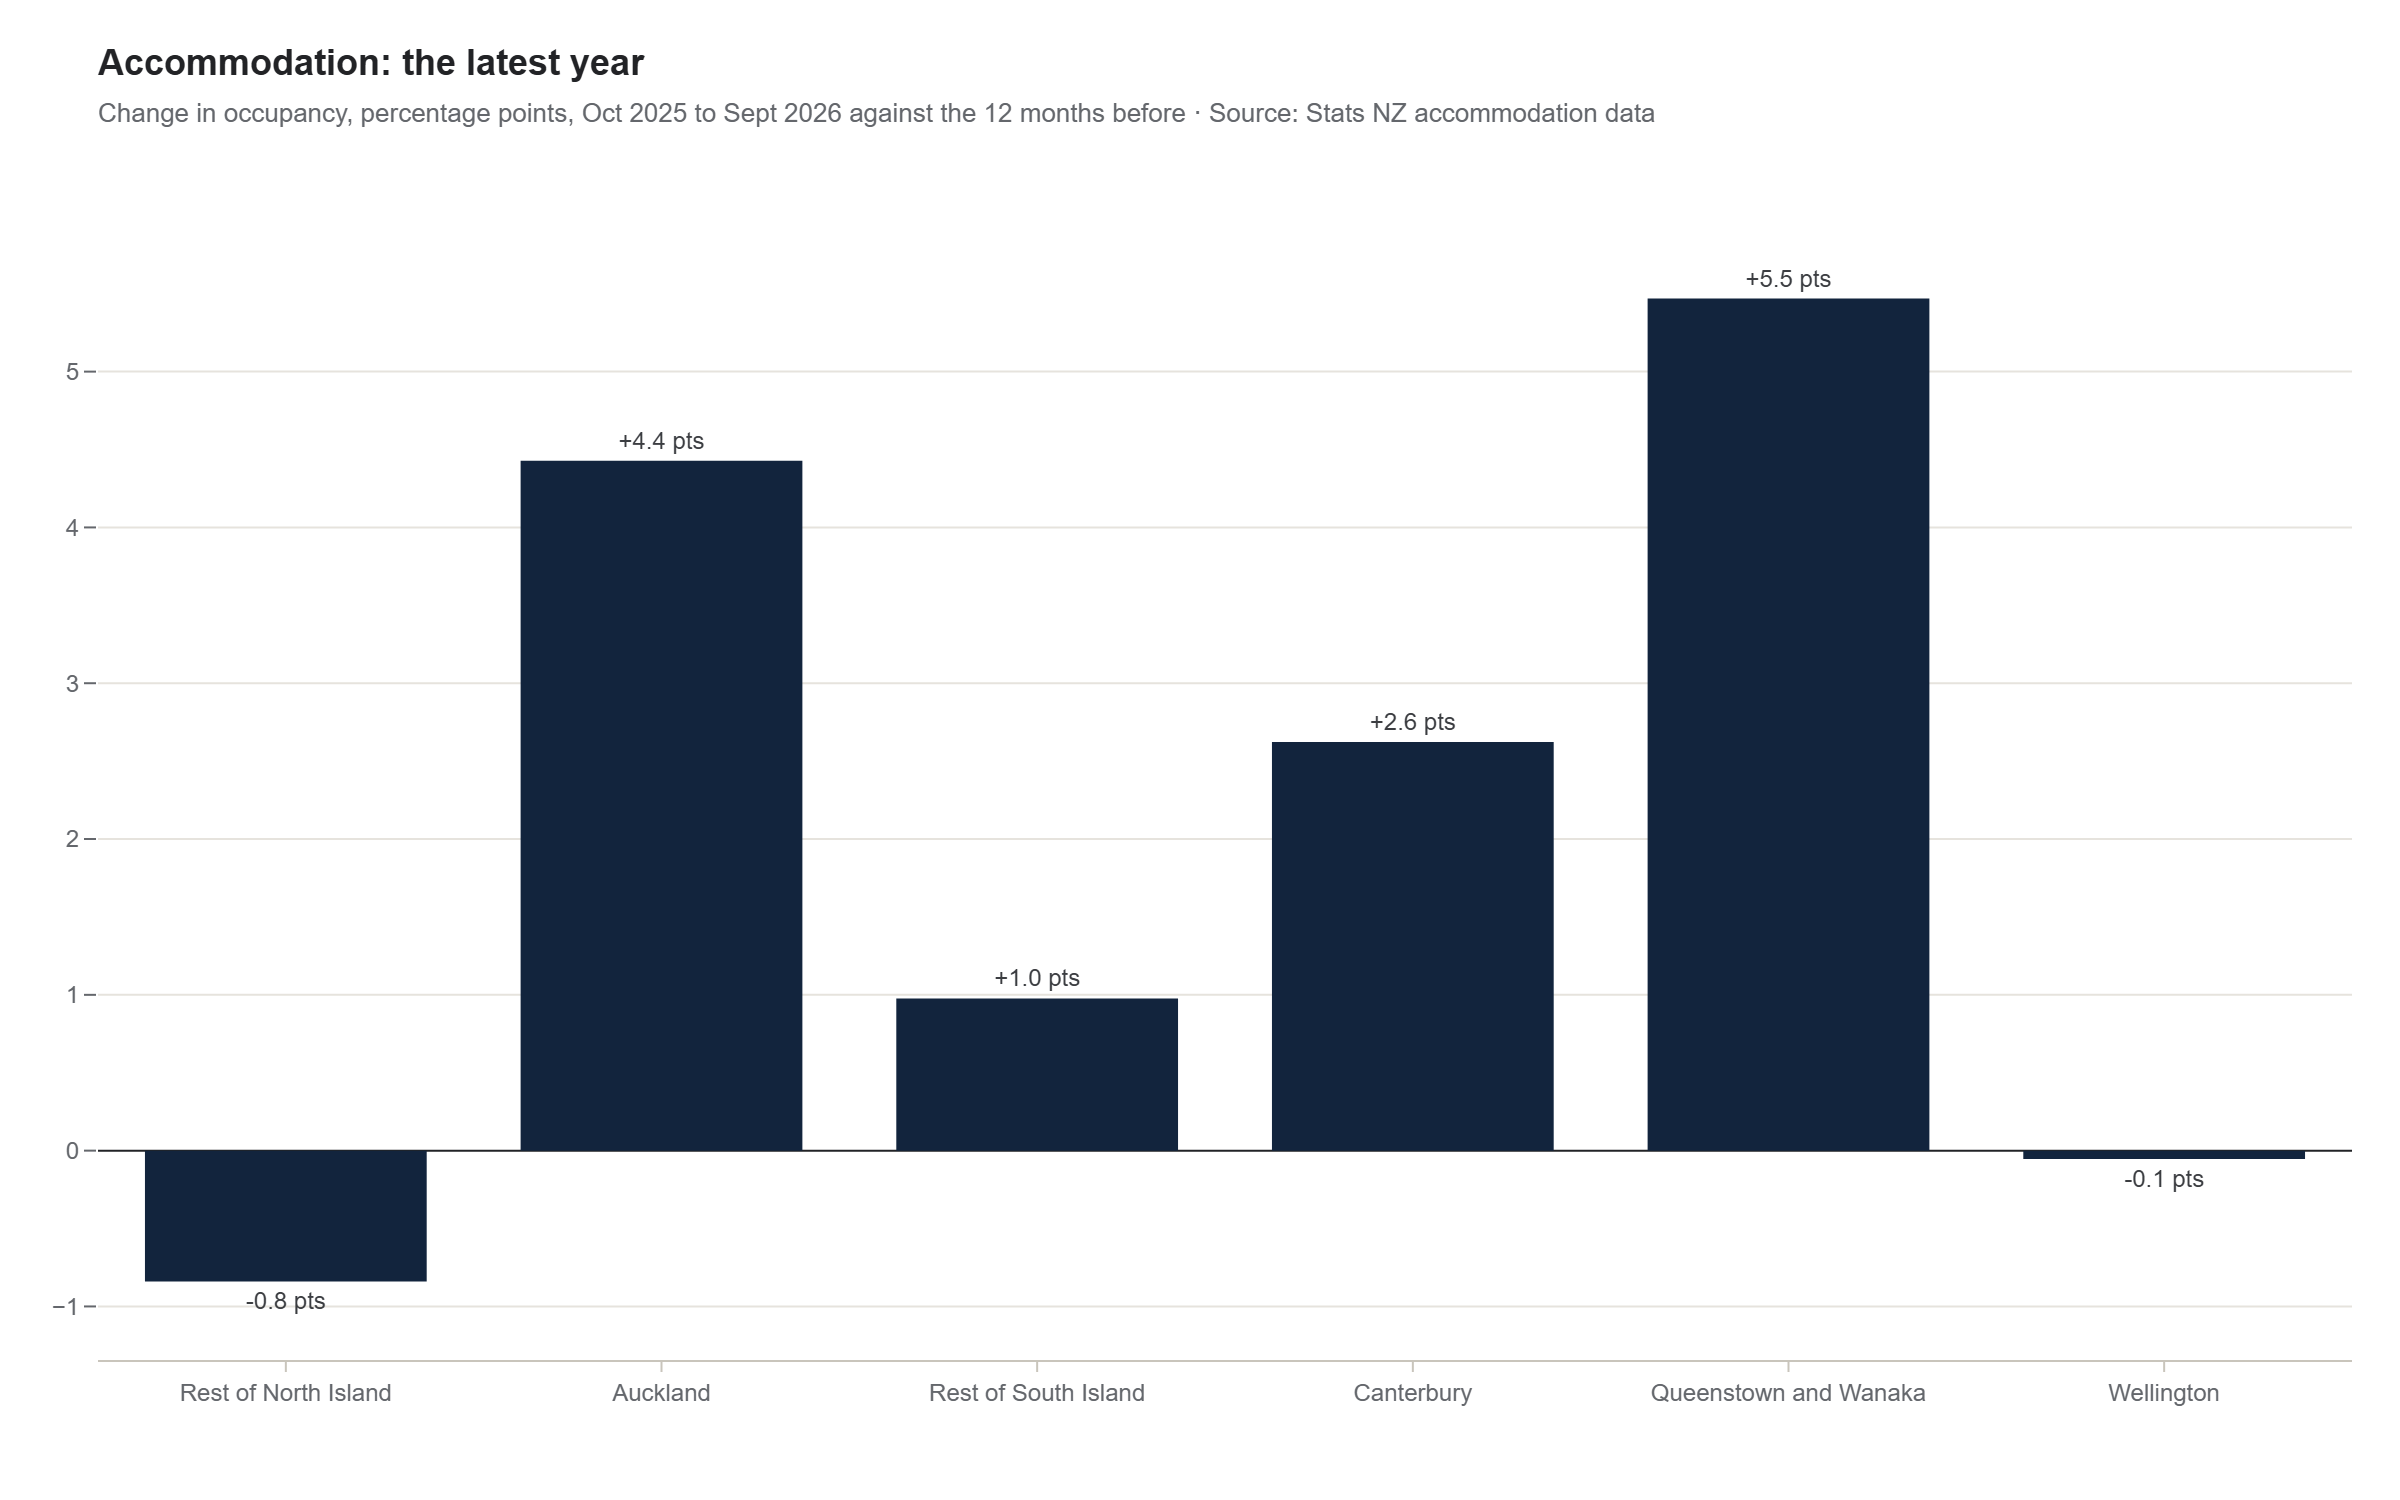
Bar chart of the change in occupancy by region, latest 12 months against the 12 before, in percentage points. Queenstown and Wanaka +5.5, Auckland +4.4, Canterbury +2.6, rest of South Island +1.0, Wellington −0.1, rest of North Island −0.8.
October 2025 to September 2026 against the 12 months before, percentage points.
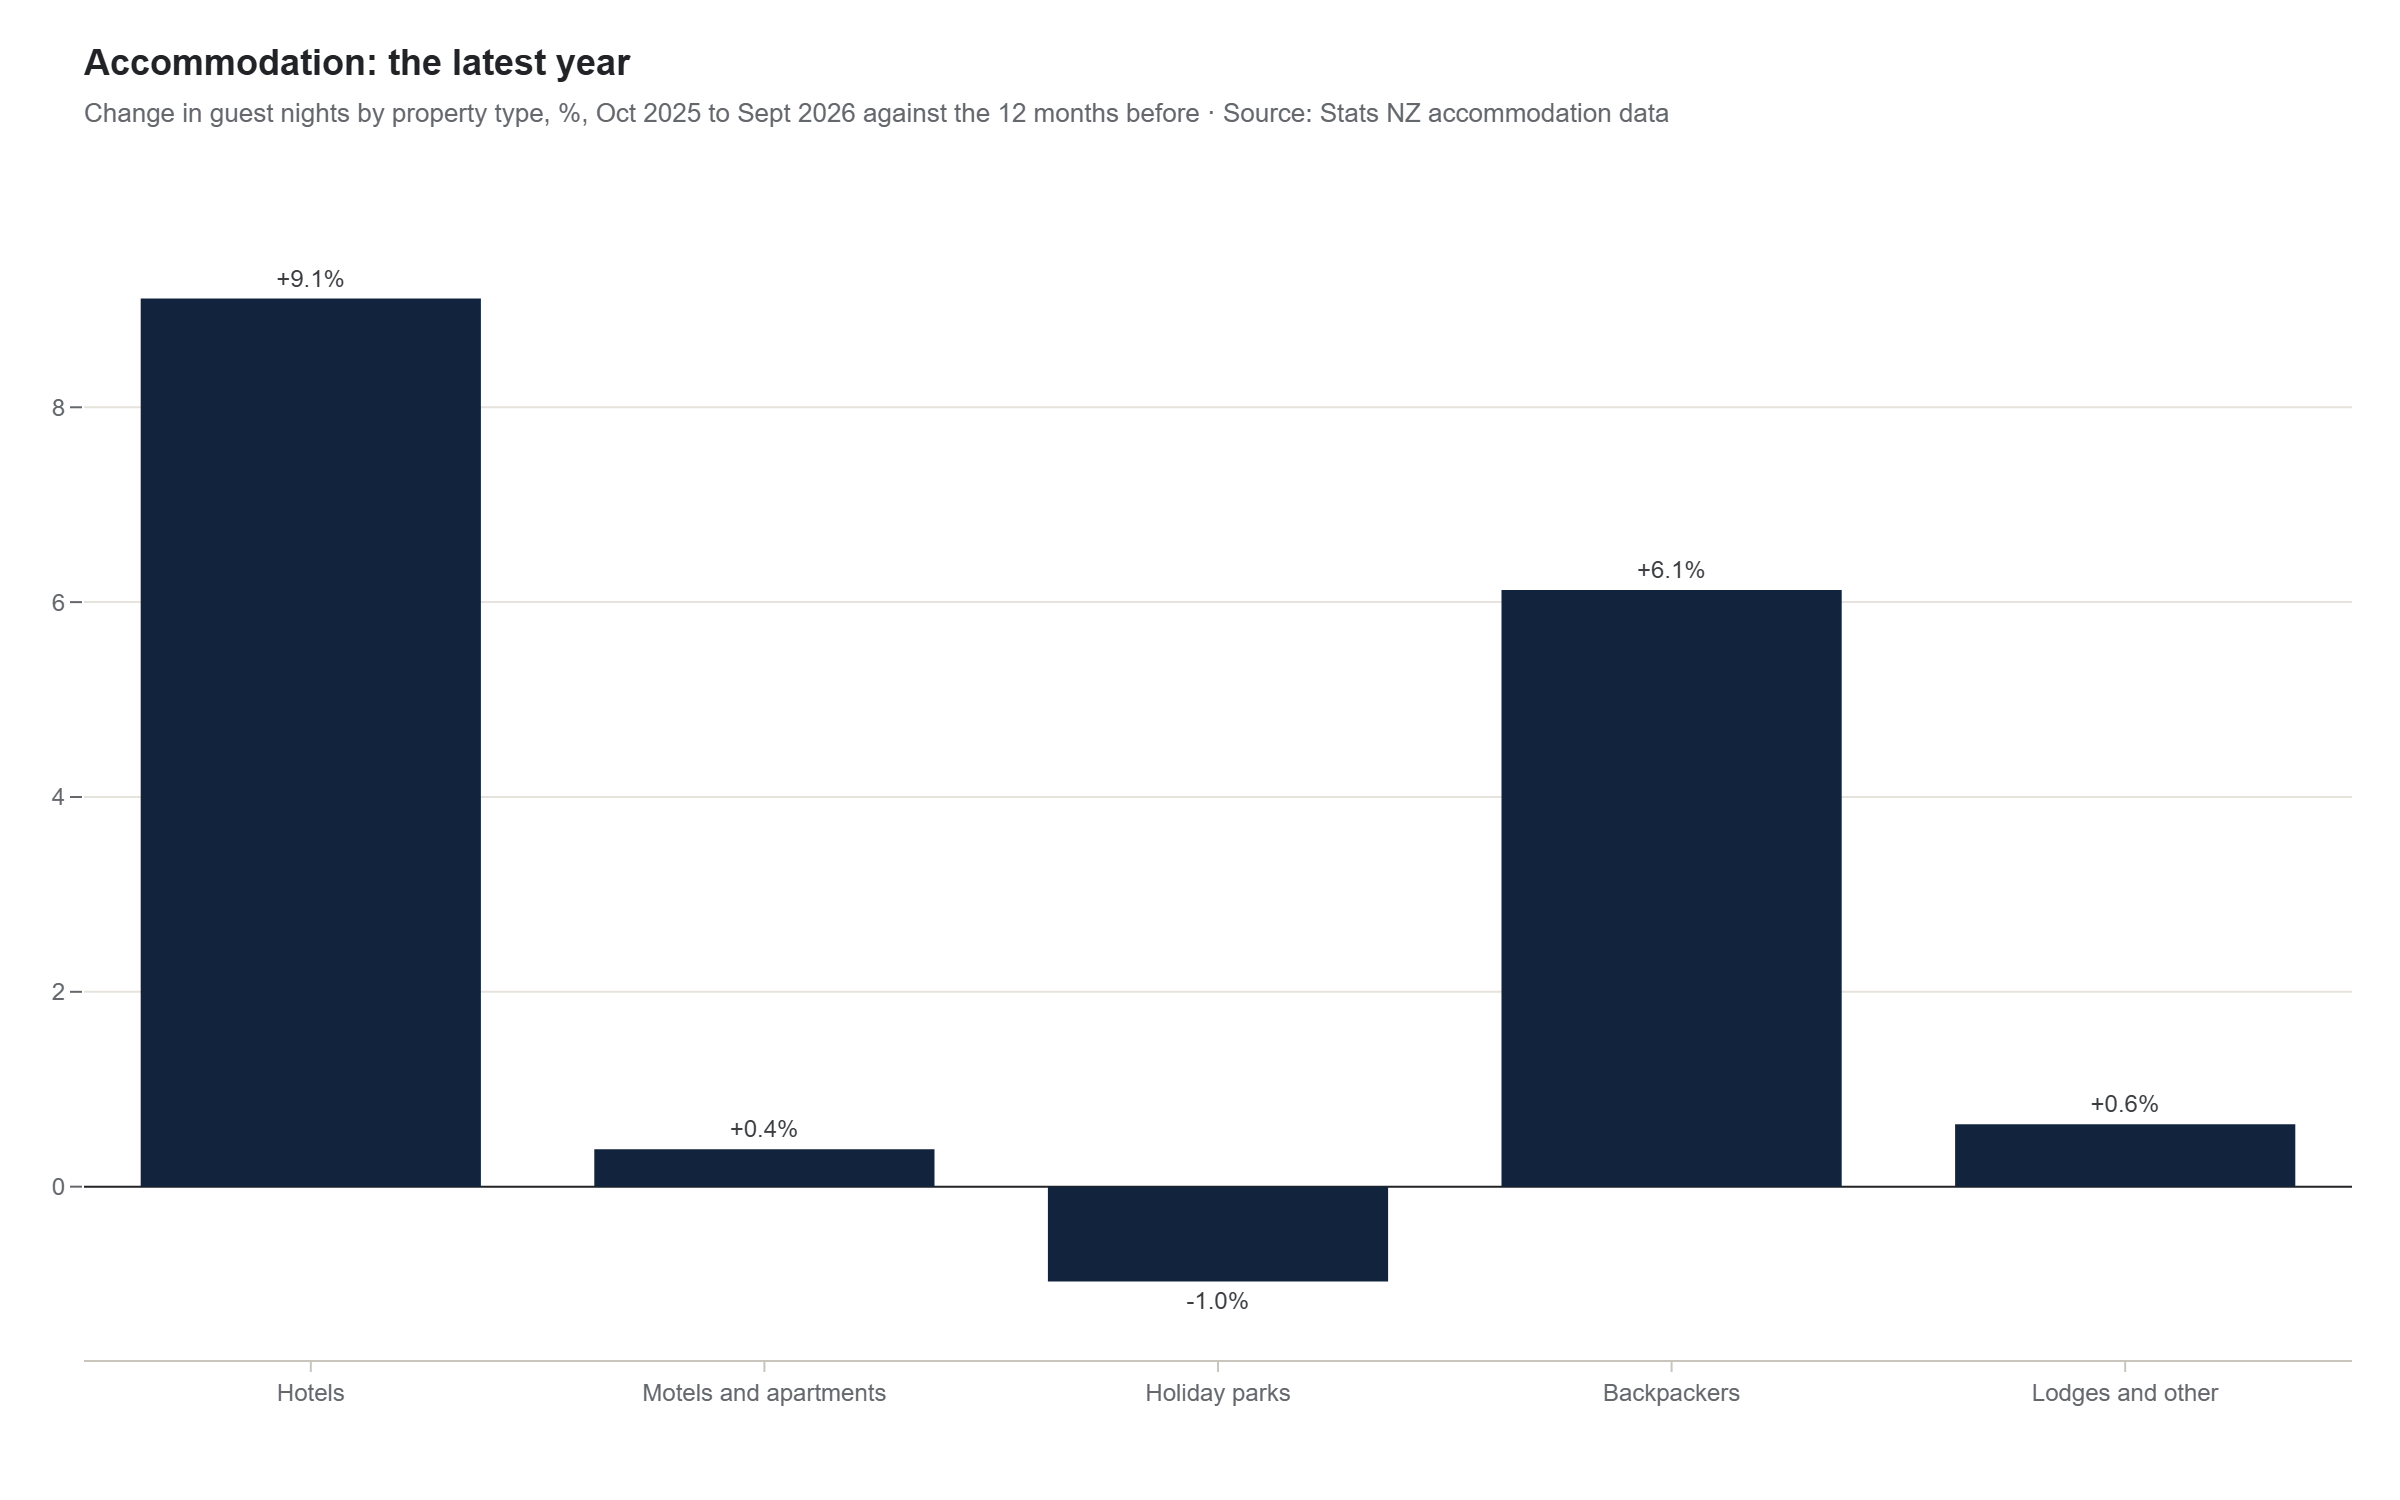
Bar chart of the change in guest nights by property type, latest 12 months against the 12 before. Hotels +9.1%, backpackers +6.1%, lodges +0.6%, motels and apartments +0.4%, holiday parks −1.0%.
October 2025 to September 2026 against the 12 months before, per cent.

Then there's the longer view. Compared with 2019, domestic nights are up 11% and international nights are down 12%. Either something big has shifted, or the measurement has. MBIE's Accommodation Data Programme replaced Stats NZ's survey in 2020, and MBIE is clear the two aren't directly comparable: they cover different properties, measure capacity differently and define accommodation types differently.
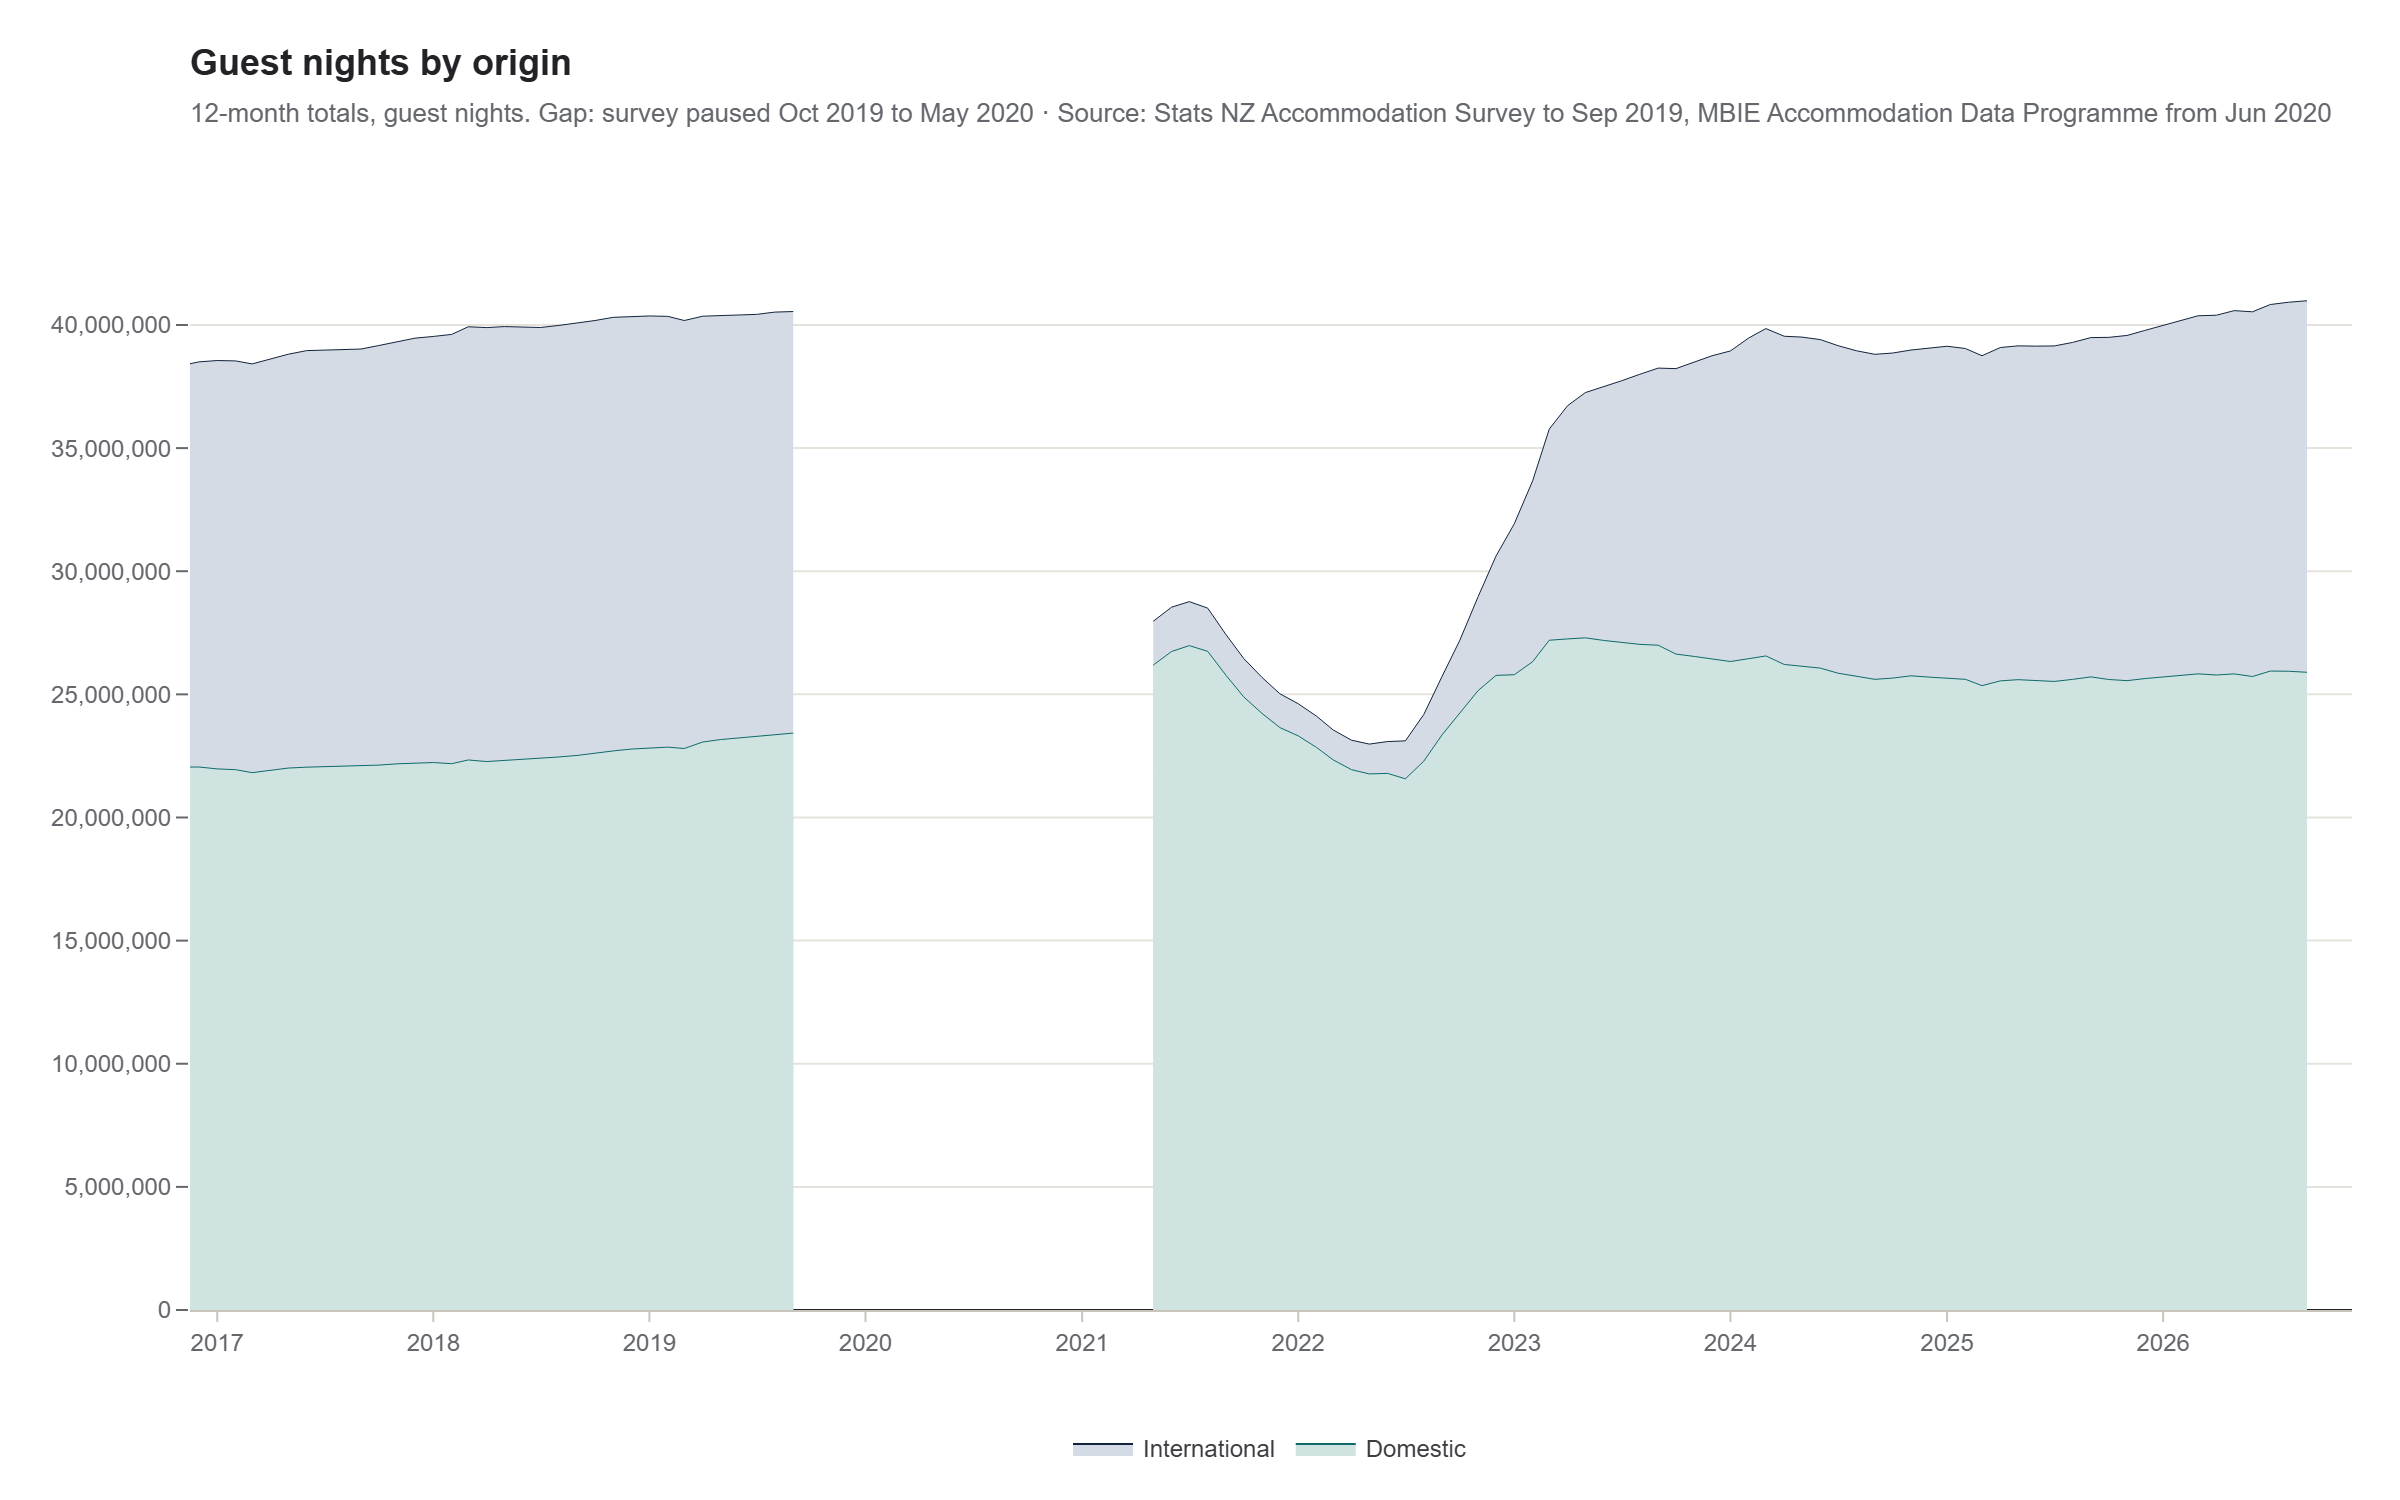
Stacked area chart of domestic and international guest nights, 12-month totals, 2017 to 2026, with a gap at the survey change. Before the gap: about 23 million domestic and 17 million international. Now: about 26 million domestic and 15 million international.
12-month totals. The gap is the survey pause from October 2019 to May 2020; figures either side come from different surveys.

That frustrates me. Data like this is exceptionally useful, and I find myself second-guessing whether it's telling me the right answer.

Explore the accommodation data

Sources: MBIE Accommodation Data Programme (from June 2020); Stats NZ Accommodation Survey (to September 2019). Guest nights count one person staying one night.

Need analysis like this? Get in touch.